

Think of your product catalog like a garden. Some plants feed the family. Others drain water and sunlight but never bear fruit.
Most founders water everything equally, then scratch their heads wondering why the harvest feels thin. That’s founders lighting money on fire to protect products no one cares about.
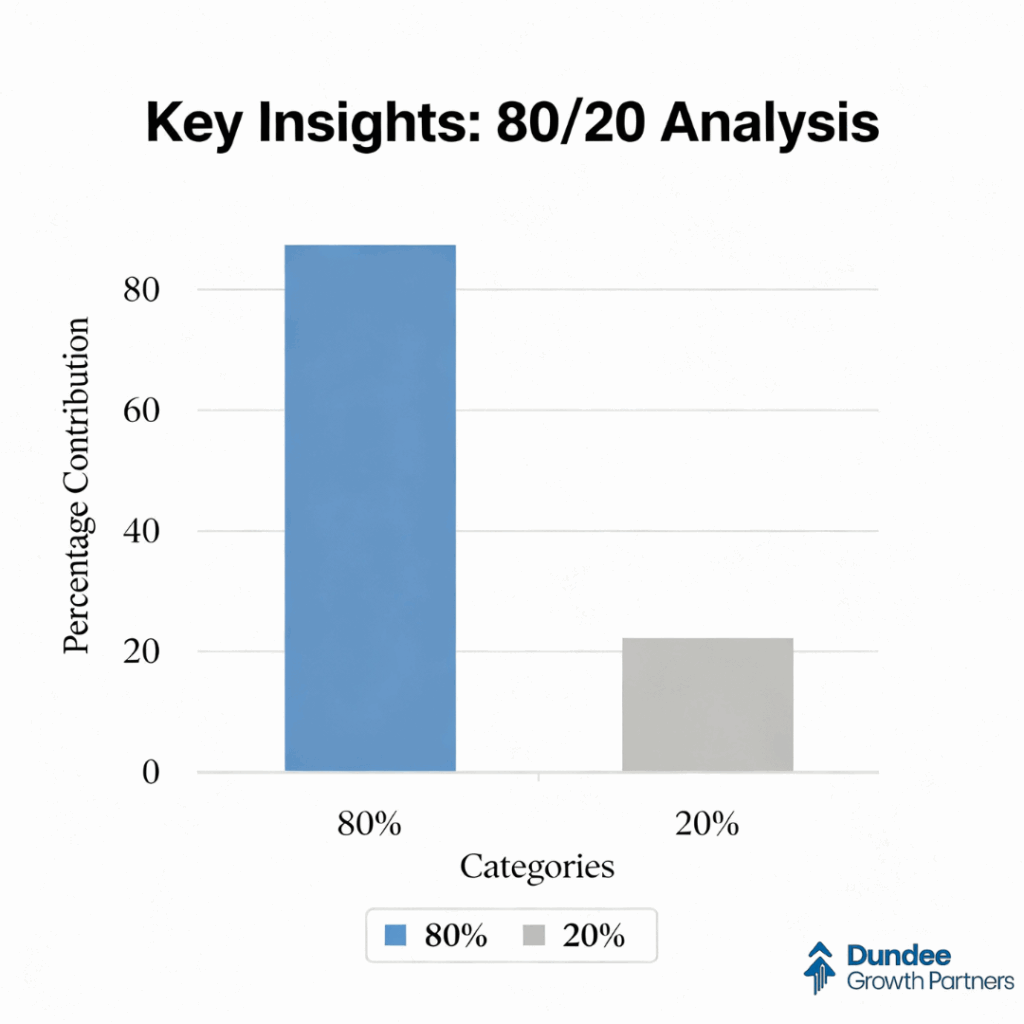
Here’s the brutal truth: in almost every 7-figure DTC brand we analyze, 20% of SKUs drive 80% of revenue. Yet founders spend as much time, money, and brainpower on the other 80%. Stop the madness.
At Dundee Growth Partners, we built the 80/20 Revenue Map to stop the bleeding, sharpen focus, and scale around what actually works.
Step 1: Pull 12 Months of Clean Order Data
Most founders think they know their best sellers. Wrong.
Until you run the numbers, you’re guessing. And guessing in business? Expensive.
Jennifer DiMotta, Founder & Managing Partner, on clean data:
“Clean data tells the real story. I don’t just look at revenue — I strip out returns, promos, and bundles. Until you see net contribution, you’re flying blind. That’s where founders waste months of cash chasing the wrong products.”
- Pull a full year of net revenue, not gross.
- Back out returns — those refunds are silently killing margins.
- Separate promos and bundles from core SKUs.
One founder swore their “hero SKU” carried the brand… until the data showed it was refund-ridden, barely profitable, and masking the real star three rows down.
Step 2: Rank SKUs by Revenue Contribution
Most founders think more products = more revenue. Wrong. The answer is more focus.
Rank SKUs by contribution:
- Top 10 SKUs = 60–70% of revenue
- The rest = dead weight
We once saw a founder pouring 40% of ad spend into 60 SKUs that made up less than 10% of revenue. They were shocked when the data showed 3 products carried the whole company.
Lesson: your budget, your team’s attention, and your inventory have one job: fuel the winners. Stop trying to save the losers.
Step 3: Reallocate Resources
This is where the rubber meets the road. Stop analyzing. Start reallocating.
- Ad spend: Put it behind proven winners.
- Inventory & operations: Streamline around profitable SKUs.
- Mental bandwidth: Stop obsessing over dead SKUs. Less clutter = more leverage.
Jennifer’s real-world example:
“One client had 50 SKUs eating up margin and attention. By cutting the dead weight, we freed cash to invest in the top 5 products. Within months, profits soared and the team’s focus sharpened — it was like flipping a switch.”
Step 4: Track, Review, Repeat
SKU bloat isn’t a one-time fix. It always comes back. Discipline is everything.
Review monthly or quarterly. Ask:
“Does this SKU still earn its spot, or is it dragging me down?”
Stop reacting to vanity metrics. Start reallocating like a scalpel, not a hammer. Protect the few SKUs that actually scale you.
The Takeaway
The 80/20 Revenue Map delivers:
- Clarity: you finally see what drives the business.
- Cash freed: no more funding losers.
- Sharper margins: every dollar goes to what works.
Most founders think growth means more.
Truth: growth almost always means less.
Stop guessing. Stop wasting.
Want the same playbook we use with 7–9 figure founders? Subscribe to The Dundee Edit.